
We’ve heard it time and time again that content is king and distribution is queen. Yet when will more content marketers assign content marketing performance analytics a title in the kingdom of content? Content analytics is one of the most important aspects of content marketing, but it tends to be ignored or barely analyzed despite its important role in the content manufacturing craze.
The bar needs to be raised for content marketing performance analytics. It’s not a simple snapshot from analytics solutions such as Google Analytics. Content itself is a complex piece of information, so why are analysts looking at the most basic metrics for content analytics? Visitors, pageviews, time on page, and similar metrics that can usually be found on the main page or one level down on Google Analytics are generic. Using only those basic metrics as strong indicators of content is a superficial view of content as a whole.
A strong content performance analysis will be insightful and bring actionable metrics. Basically, a content performance analysis should result in more than “Ooohs” and “Aaahhhs” and actually answer the questions “What do these numbers really mean in relation to content?” and “Why should I care?”
That means that there should be a select few actionable metrics that analysts need to use to analyze content performance. If analysts have and consistently review hundreds and hundreds of metrics, it will be hard to gather any insight out of that large sea of metrics. So by focusing on the strong go-to metrics, analysts will be able to measure the effectiveness of content and know what content should be created.
Content marketing performance analytics is more than jumping around in a puddle of metrics. Content marketing needs an ocean of context. So let’s find out how to advance your analysis of content effectiveness.
Filling your ocean with fish and not trash
Before we start explaining how to analyze and report your content performance, remember that your content analytics reports should be full of quality information. While it may be tempting to put every metric from your analytics solution plus any calculated metrics you created into a report, know that none of your superiors will want to read pages and pages of useless information. For content analytics, it’s better to have a couple of pages of relevant information than 15 pages of fluff.
Let’s go through what you need to evaluate and include in your content marketing performance analytics report:
- The basics
- The channels that drive traffic to your content
- The leads acquired from content
- The repeat visitors from your target audience

Know the basics of Content Marketing Performance Analytics
While earlier in the post analysts were advised to steer clear of reporting only on the basics, it doesn’t mean that the basics aren’t important. Knowing the number of visitors and pageviews from your content, which channels led them to the content, and how many content pages they visit are all important. But the basics are not everything. You need to focus on getting the context and buckets of content right.
For context of content, we mean the types of content fit for your target audience. If people are bouncing off your content pages, they’re probably not finding what they want. If, on the other hand, visitors are constantly reading and engaging with your content, then your type of content is fit for your target audience. So producing content that is relevant is key to getting the context right.
As far as getting your buckets of content right, think of the buckets as your content categories. For instance, if you have three sections of where your content is on your site – how tos, knowledge base, and opinion articles – make sure that your content is organized in such a manner that is related to the content sections and their purpose (ex: evergreen vs. timely content).
But back to marketing analytics basics. Say, for instance, that you go into Google Analytics and notice that the bounce rate is high. You won’t just stop your analysis at “The bounce rate is 85 percent.” You’ll want to apply a comparison to see how it did the week, month, or year before. Then you’ll want to add context to the bounce rate number. Why is it that high? Is your content not relevant (ex: out-of-date article)? Is your title misleading? Is your content boring? Are bots scraping your site?
There are a lot of questions that follow the statement of “The bounce rate is 85 percent.” So while basics are important and can (in some instances) be the foundation of your analysis, knowing the basics is only the first step.
Look at the channels that drive traffic to your content
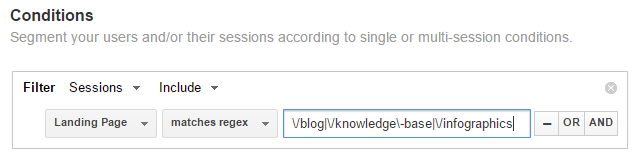
Now that the basics are out of the way, it’s time to analyze the traffic to your content pages and implement custom segments. That means you’ll need to know how to filter your analytics by your pages of articles, infographics, and other content. Below, you’ll see an example of how you can gather data based on your content pages using a segment in Google Analytics.
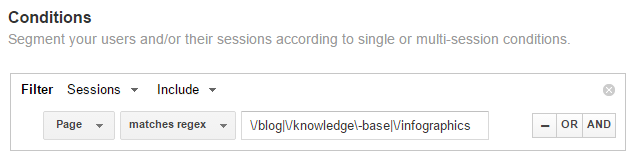
While the segment above gives analysts a better view on content-only pages, there’s still another level of detail you need to check. Even though a segment is applied to your information, it’s still generic information. So look at the channels (organic, social, referral, etc.) that drove traffic to your content pages.
Did social do better than referrals? Which pages performed best with each channel? What piece of content was hot on Twitter? What types of content did better for each channel? Was there a specific type of content or piece of content that did well across channels? Which channels (or subchannels) do you need to focus on and/or refine in relation to content marketing?
By looking at the channels that drive traffic to your content, you’ll be able to answer all of these important questions and start building a better content marketing strategy.
Acquire leads from content
Analysts and content marketers out there, you need to know how many leads were influenced by visitors viewing your content. How else will you know if your content made a visitor stop and think, “This company seems interesting, is helpful, and could help me solve [visitor’s problem]”? If you don’t report how your content influenced your visitors to want more content (and eventually your products/services), it’s time to start now.
In the above screenshot, you’ll see how we captured if a visitor came through a content page before signing up for a newsletter, creating an account, or whatever other conversion goal your company might have. You’ll have to apply this segment to a Google Analytics report where you have “Form Submission”/your conversion name as the first metric.
In case you haven’t set up event tracking to your newsletter, account creation, etc. (the join, create, or sign up button), check out Google Developer’s guide to custom event tracking.
![]()
Using the above Google Analytics segment will help content teams know how and what content influenced the visitor enough to want or learn more about your company and its products/services. Maybe that piece of content helped the visitor realize that he or she needed your products or services or that the visitor might want to learn more before buying from you.
While the analytics won’t let you know every visitor’s intentions when signing up, creating an account or whatever other conversion goal it is you have, the numbers will help paint a picture of how many people converted based on your content they consumed. And this is key, especially since this segment shows how many visitors first came to a content page (not the homepage or any marketing page) and then later decided (possibly after browsing more of the site) to convert.
Acquire your target audience and drive repeat visits
Now that you have acquired leads from your content, you need to keep them coming to your site. Retaining repeat visits here isn’t the simple go-to number that you can get on the main dashboard of Google Analytics. You want visitors to come back to your site, specifically your content pages. But how do you check that?
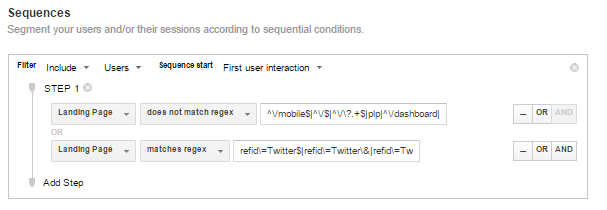
With the above Google Analytics segment, you can view who initially entered your site through a content page and came back later to any page on the site. To further explain the segment, you’ll want the landing page to not match any non-content pages (such as the homepage, marketing pages, account login, account dashboard, etc.); however, you do want your landing pages to match any of your content from referral/social traffic with refids (Ex: https://www.bayleafdigital.com/live-streaming-isnt-the-future-its-now/?refid=Twitter).
Once this segment is applied, you can find out which pieces of content drove more repeat visits (meaning that the content could have been engaging and left the visitor wanting more of your well-written content that was entertaining, informative, etc.).
By looking at which content drove repeat visits, you might find a pattern. Say, for instance, you had a group of related articles that drove repeat visits. What about those articles was so appealing? Why isn’t your other content driving as much interest? Are those articles evergreen instead of timely content? By seeing which content drives repeat visits to your site, you can know what types of content you should create next and discard from your current content calendar.
It’s time for content marketing performance analytics to rule
Content analytics is not one-dimensional, so it’s time to using different lenses to analyze content. Content marketing performance analytics is like a Russian nesting doll. Without opening it up, you’ll never find out what else is inside. Hopefully these Google Analytics segments will help deepen your content effectiveness analysis and provide better insights to what you should and shouldn’t do next in your content marketing strategy.
If your looking to learn more about the types of content marketing performance analytics you should be monitoring, check out our ebook Ultimate Guide to Content Marketing for SaaS


